In general, a high-quality figure can be produced using these two software, which are Gnuplot and $\LaTeX$, and this can be done in three simple steps. Alternatively, one can also use Python3.5 and Matplotlib to generate such a high-quality figure, which is a much simpler way. But as the complexity of figure increases, the former method we have mentioned may have an advantage.
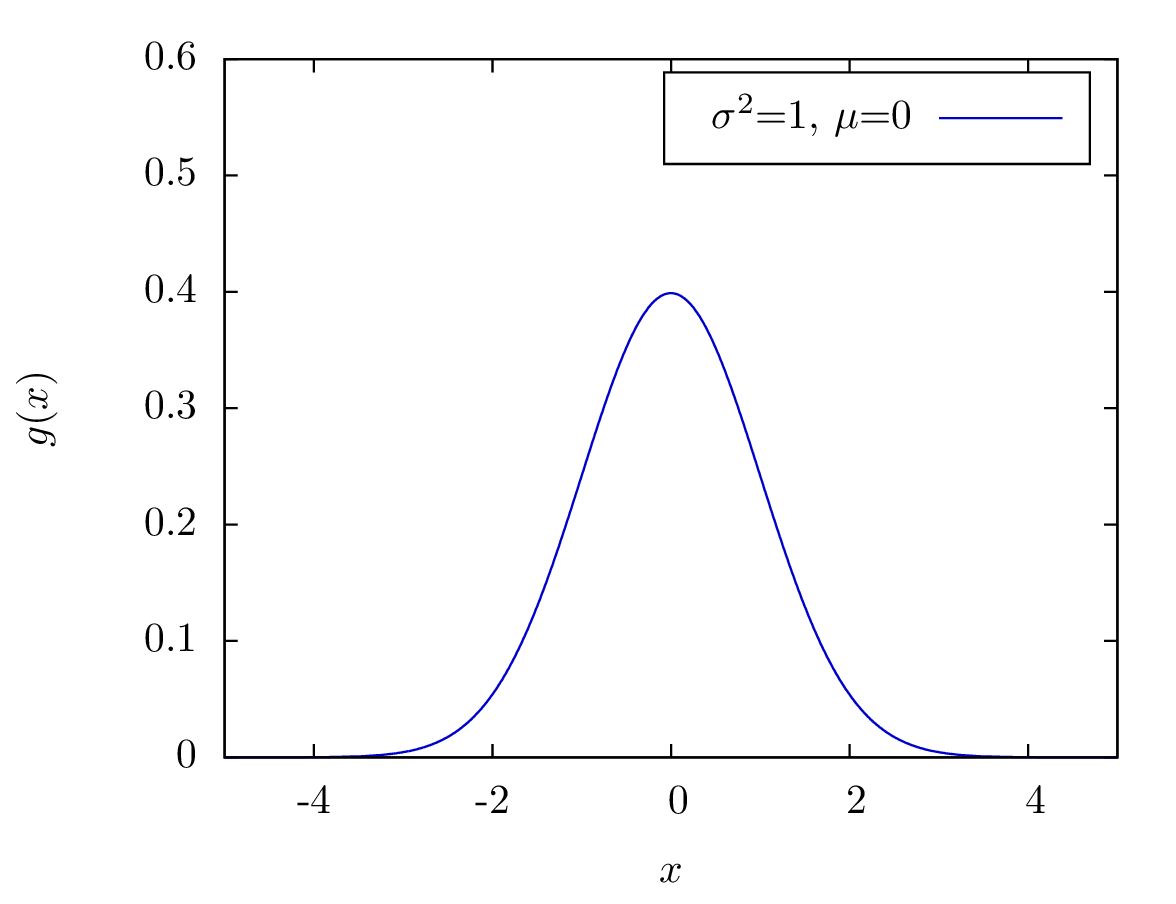
Firstly, we have to generate a data file for the plot using C++ program. This C++ program takes input values of the peak width and peak position of the Gaussian function.
Secondly, a script is written for Gnuplot in order to generate a .tex file.
set term epslatex color size 4in,3in
set xrange [-5:5]
set yrange [0:0.6]
set ylabel '$g(x)$'
set xlabel '$x$'
set out 'plot.tex'
set style line 1 lc rgb '#0000cc' lt 1 lw 2 pt 7 ps 0
set key inside right
set key box
set key spacing 2
plot "sigma-1-mu-0.txt" with linespoints ls 1 title "$\sigma^2$=1, $\mu$=0"
set out
Finally, a figure in .pdf format is generated by executing the following code with Texmaker.